Анализ магнитных и тепловых полупроводниковых силовых модулей
Привет всем, я Саумитра Ягдейл. Добро пожаловать в новый пост сегодня. В этой статье были проведены обширные исследования электротермических свойств чипа IGBT для трехмерной структуры упаковки в чипах IGBT.
Темы, затронутые в этой статье: |
Ⅰ. Магнитный и термический анализ силовых модулей |
Ⅱ. Извлечение предлагаемой модели |
Ⅲ. Моделирование и результаты |
Ⅳ. Заключение |
За последние несколько лет полупроводниковые технологии прошли долгий путь, особенно в области силовой электроники с применением в исследованиях и тяжелой промышленности. Модули биполярных транзисторов с изолированным затвором (IGBT) играют решающую роль, поскольку они реализуются в приложениях с высокими рабочими температурами, высокой скоростью переключения, более высокой надежностью и т. д. В таких ситуациях получение точных результатов имеет первостепенное значение, поскольку может быть несколько опасных последствия для цепей или даже для пользователей, эксплуатирующих схемы, если они не рассчитаны правильно.
Ⅰ. Магнитный и термический анализ силовых модулей
Проведенный эксперимент представляет собой моделирование, в котором электрические, тепловые и магнитные характеристики IGBT проверяются во время работы схемы.
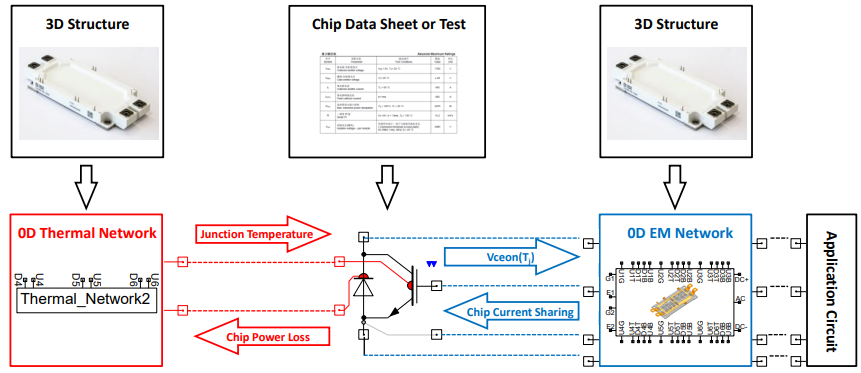
Рис. 1: Схема предлагаемого метода ЭМ-электротермического анализа.
Паразитные свойства между поверхностями чипа (коллекторами, эмиттерами и затворами) и внешними выводами модуля представлены этой электромагнитной сетью. Модель электротермического чипа IGBT строится в виде схемы, представляющей зависимость условий рабочей точки с использованием аппроксимации кривой и взвешенной интерполяции результатов экспериментальных испытаний или таблиц данных. Эта электротермическая модель действует как важное связующее звено между тепловой и ЭМ-сетями, поскольку она должна принимать информацию Tj от каждого чипа и возвращать значения потерь мощности первому, а также принимать существующую информацию и восстанавливать падение напряжения во включенном состоянии чипа (Vce( о)) значения к последнему.
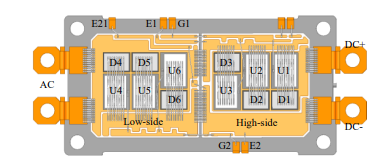
Рис. 2. Схема полумостового силового модуля IGBT 1700 В/450 А.
Данные о частотно-зависимых значениях сопротивления и индуктивности между внешними клеммами и поверхностями микросхемы, например, от клеммы питания DC+ модуля до поверхностей коллектора микросхем IGBT переключателя верхнего плеча, включены, как показано на рисунке 2.
Ⅱ. Извлечение предлагаемой модели
До недавнего времени исследования самосогласованного взаимодействия электрических и тепловых характеристик силовых модулей были интересной темой, поскольку включают в себя технологии, которые можно использовать для преодоления ряда препятствий с помощью метода ПЗУ.
While conducting the tests, all thermal characteristics were considered along with an assumption of an intact cooling boundary at the bottom for further simplification and efficiency. Moreover, a baseplate temperature of 90![]() was set during the simulation of the bottom process.
was set during the simulation of the bottom process.
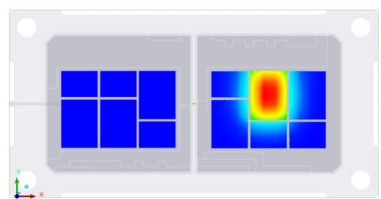

Fig 3: Temperature distribution when power loss is applied only to U5
As shown above, Fig 3 depicts the thermal behaviour of the entire packaging structure which was recorded to study accurate electro-thermal coupling.
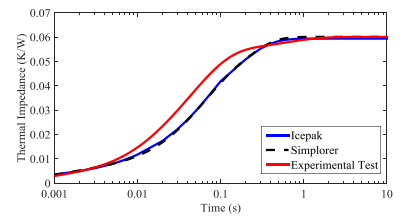
Fig 4: Comparing results of Icepack SVM, Simplorer thermal network and experimentation test
Fig 4 shows the effectiveness of the extraction process to demonstrate its comparison with different results. For instance, the comparison was done among Icepak FVM simulation, Simplorer thermal network simulation and experimental test results to check the thermal resistance of the low side switch. The graph with thermal network topologies shows identical simulation results as that of the standard FVM simulation. The current sharing properties of the IGBT depend on the frequency of the parasitic components of the module packaging which also includes the resistance and inductance of the conduction paths. During its application, each conduction path from the external bus bar terminals to the chip surfaces in the IGBT module application may have an effect on how current is spread among the chips and how each chip switches by itself. This makes it very important for the modules to characterize the parasitic values from all external terminals to the surfaces of each chip.
Ⅲ. Simulations and Results
Once the extraction process of the IGBT chip model is complete, simulations for the thermal and EM networks and their analytical representations are taken into consideration for the study of their module performance in chopper circuits. In such chopper circuits, while IGBT modules are operating at high frequencies, a 900V DC power supply is set with a load connected in parallel to the high side switch for three IGBT switches and three FRD chips
Analytical Solution: In a chopper circuit, it is very important to take into account the current sharing and temperature dependency of the power losses due to which the loss can be viewed in an analytic solution.

From the above equation,  is the turn on and turn off of the IGBT chip at
  is the switching frequency.
Electro-Thermal Simulation: As shown in the below figure, an addition of a thermal network above the electrical simulation was used in getting the simulated output. The temperature-sensitive electrical properties of the chips, such as the loss energy and Vce(on) values, can be dynamically updated by linking the thermal pins of the electro-thermal chip model to the thermal network. This enables the power losses calculated from the circuit simulation to be supplied into the thermal network.
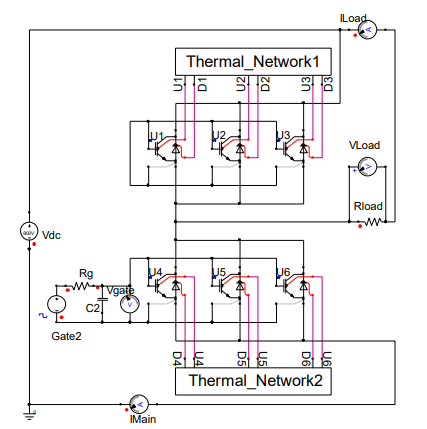
Fig 5: Electro thermal simulation topology
EM-Electro-Thermal Simulation
As seen above, the thermal and EM networks which show the different imbalances in impedance and parasitic components should always be reviewed for smooth operations. Networks with zero-dimensional setups were also utilized in the EM-electro-thermal analysis.
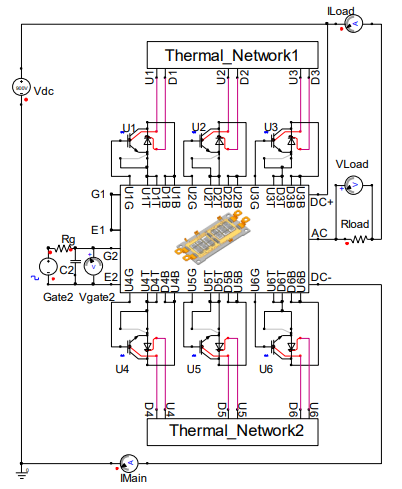
Fig 6: EM-electro-thermal simulation topology.
In Fig 6, the EM and thermal networks are integrated together in the simulation circuit. Using EM networks, the IGBT chip electro-thermal models are embedded into the application circuit during the working.
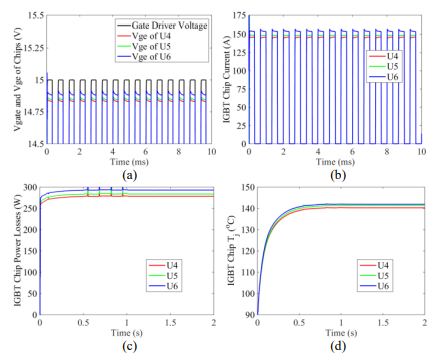
Fig 7: Simulation results (a) Gate driver voltage and Vge of chips (b) IGBT chip current values (c) IGBT chip averaged total power losses (d) IGBT chip Tj variation.
In figure 7, the simulated outputs in different conditions and temperatures are shown for further understanding of the IGBT and its performance. The IGBT chip U6 in Fig. 11 (a) has the highest Vge value due to its proximity to the module packaging's gate control terminals, Figure 7 (b) displays the current distribution among the three paralleling chips. As per Fig. 11, Chip U6 describes the highest averaged total power loss (c) and In Fig. 7, the Tj variation over time is depicted (d). If there are temperature instabilities in the IGBT, there are various possibilities for long-term issues which may increase power loss and thermal stress.
Ⅳ. Conclusion
The behaviour of IGBT semiconductor power modules with the EM-Electro-Thermal coupling, along with current sharing properties and thermal characteristics was studied. The simulation results conducted were achieved perfectly as per the prediction making it further scalable in various physical and electronic domains. With the results obtained, it can be said that there are higher chances to reveal the effects of IGBT power module packaging on the electro-thermal behaviour of the chips. With more extensive research on this topic, such systems can even be deployed in complex devices and have enhanced reliability.


